Record a node memory leak debugging


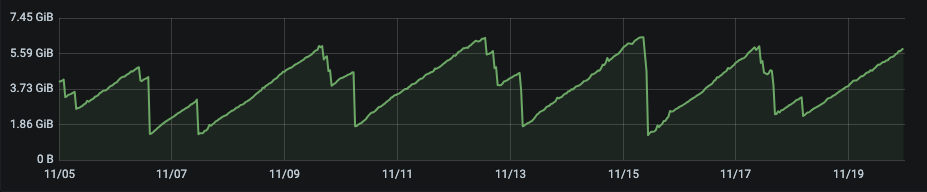
Recently, I took over a project that has a memory leaking problem.
Collect Data
- choose tool
I chose to use heapdump to generate a memory snapshot and then imported it to Chrome DevTools, which can reflect changes in memory.
- code
function collectMemory() {
  heapdump.writeSnapshot('./' + Date.now() + '.heapsnapshot')
}

setInterval(collectMemory, 60000)
Put the above code into main.js or index.js. After one minute, you should see a new file appear in your project. If the memory usage does not increase significantly after one minute, you can increase the wait time accordingly.
Analyze Data
- import to devtool
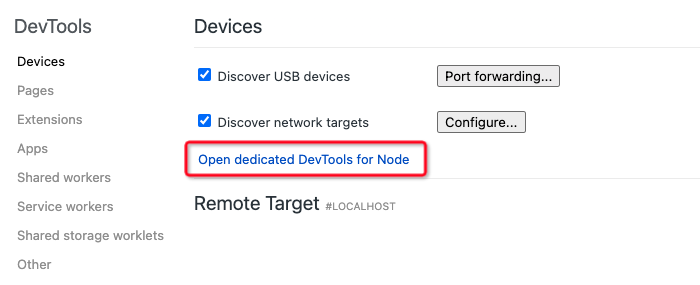
Open chrome://inspect, click this
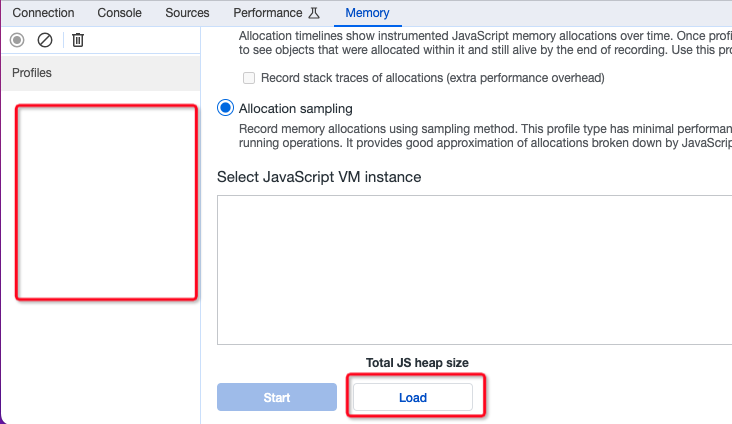
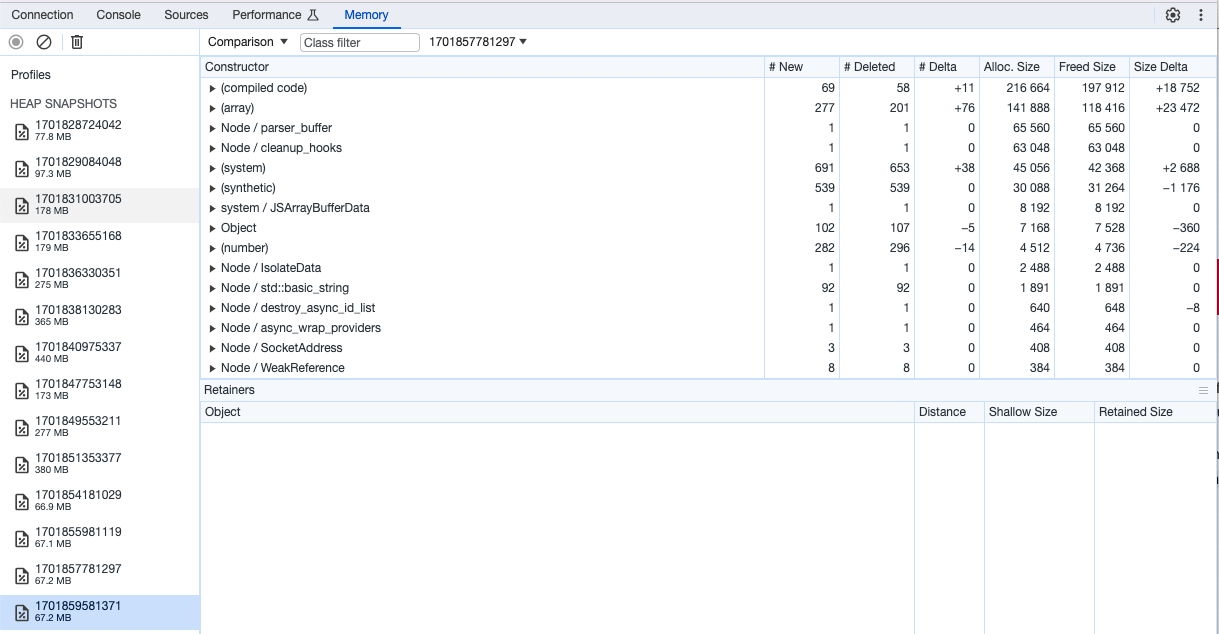
On this window, click Memory, click load or right click empty area on the left, import snapshot file order by time
- look for clues
There is a main function we need to focus - Comparison.
Choose a snapshot, then choose a earlier snapshot to compare
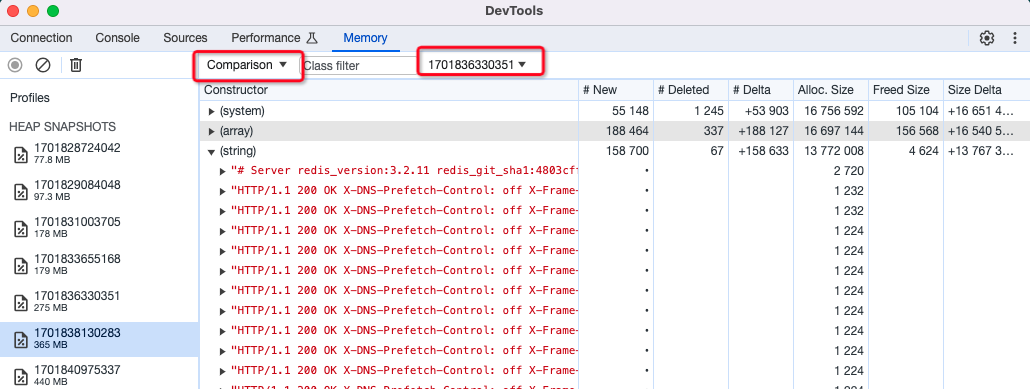
We can see a change in the “Size Delta” column of the data. I didn’t find any useful information from the system or array, so I opened the string item. There were many requested pieces of information that looked like logs.
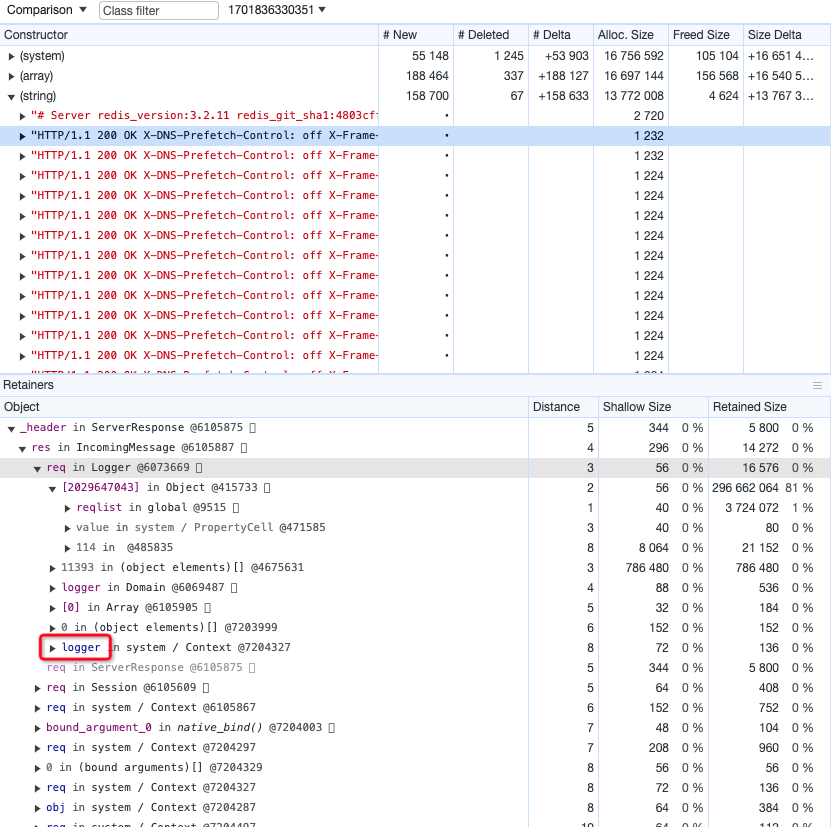
I selected a record and its details were displayed below. The function “logger” caught my attention, and I suspect that one of the log functions may be the cause of this issue.
Solution
Returning to the project, I noticed that there are three possible log functions. The first is a custom function that replaced the default console.log. The second is the logger function from nestjs. The last is a third-party module named yog-log.
Firstly, I annotated the custom log function, but after testing, I found that it was not the cause of the memory leak.
I excluded the nestjs logger as a potential cause of the memory leak since it is widely used in many projects and any memory leak issues would have been discovered long ago.
Based on the available information, it seems that the only possible cause of the memory leak is the yog-log module. Upon further investigation on GitHub, I discovered an issue related to memory leaks with this module. Additionally, I found information on the nodejs website indicating that the domain module, which is used by yog-log, is pending deprecation and may cause memory leaks.
Returning to the yog-log module, I confirmed that it uses the domain module in its index.js file and contains a function named logger, which we saw in the snapshot.
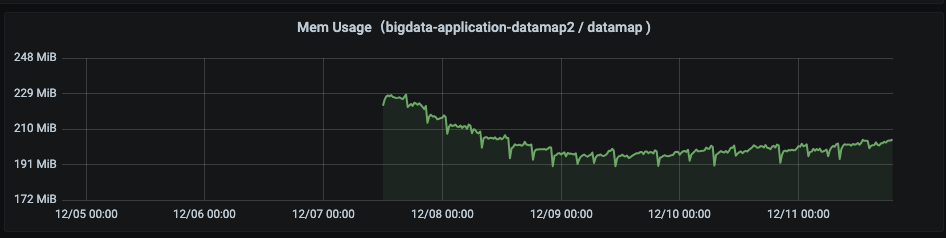
After annotating the yog-log module, the memory usage returned to normal.
Summarize
- use heapdump to collect data
- analyze snapshot to find problem
- verify result on test envirnment
Easter eggs
While writing this article, I discovered another tool called v8-profiler-rs on GitHub that provides visualization pages and auxiliary analysis reports that can help identify issues more quickly.
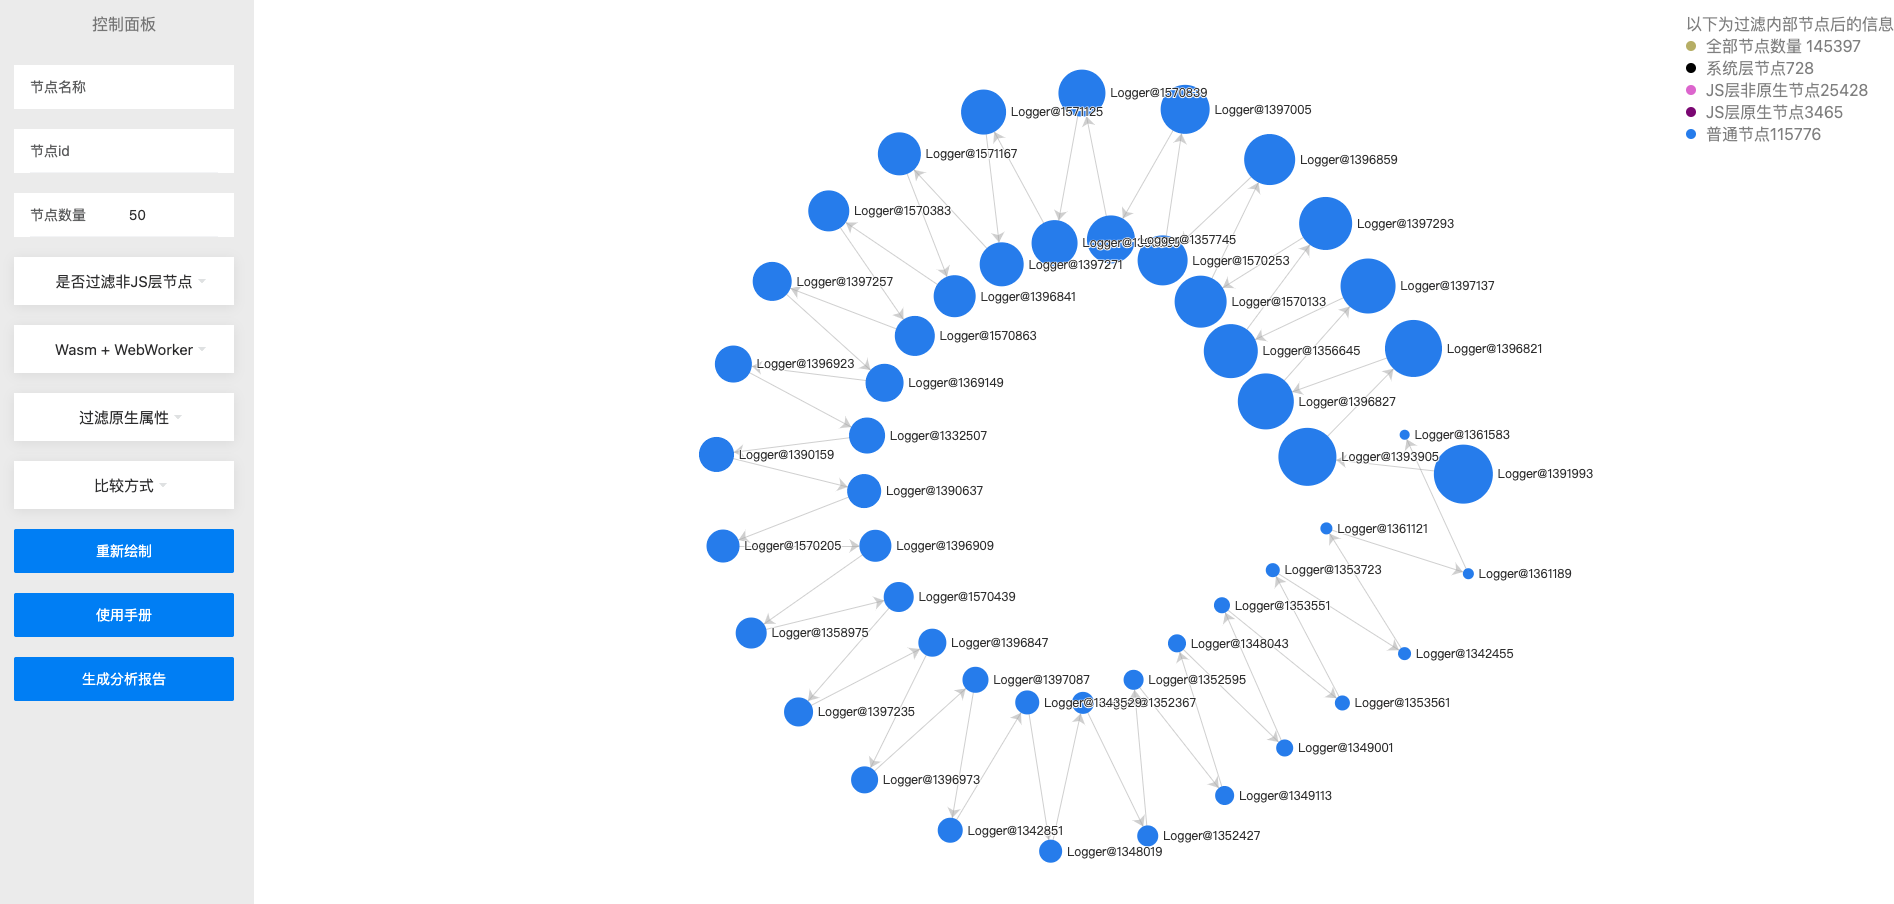
the answer is already obvious with the logger full of screen